MARCH KEY FIGURES
 |  | Mar 06 | Feb 06 to Mar 06 | Mar 05 to Mar 06 |
 |  | no. | % change | % change |
|
| TREND |  |  |  |
 | Total dwelling units approved | 12 121 | -0.4 | -8.0 |
 | Private sector houses | 8 501 | 0.3 | -2.0 |
 | Private sector other dwellings | 3 386 | -1.3 | -20.1 |
| SEASONALLY ADJUSTED |  |  |  |
 | Total dwelling units approved | 12 484 | 2.2 | -1.7 |
 | Private sector houses | 8 492 | -2.5 | -1.6 |
 | Private sector other dwellings | 3 766 | 13.8 | -0.1 |
|
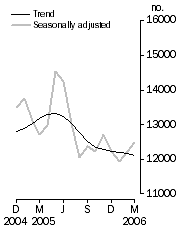
Dwelling units approved, Total number

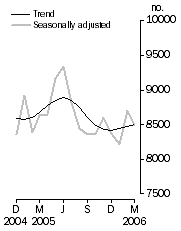
| Private sector houses approved, Total number

|
MARCH KEY POINTS
TOTAL DWELLING UNITS
- The trend estimate for total dwelling approvals fell 0.4% in March 2006, the tenth consecutive monthly fall.
- The seasonally adjusted estimate for total dwelling units approved rose 2.2%, to 12,484, in March 2006.
PRIVATE SECTOR HOUSES
- The trend estimate for private sector house approvals rose 0.3% in March 2006.
- The seasonally adjusted estimate for private sector houses approved fell 2.5%, to 8,492, in March 2006.
PRIVATE SECTOR OTHER DWELLING UNITS
- The trend estimate for private sector other dwellings approved fell 1.3% in March 2006.
- The seasonally adjusted estimate for private sector other dwellings approved rose 13.8%, to 3,766, in March 2006.
VALUE OF BUILDING APPROVED
- The trend estimate for the value of total building approved rose 0.3% in March 2006. The value of new residential building rose 1.3%. The value of alterations and additions rose 0.1%. The value of non-residential building approved fell 1.2%, the fifth consecutive fall after nine months of growth.
- The seasonally adjusted estimate for the value of total building approved rose 5.4%, to $5,157.0m, in March 2006. The value of new residential building approved rose 6.1%, to $2,659.3m. The value of alterations and additions fell 14.5%, to $446.6m.
NOTES
REVISIONS THIS MONTH
Revisions to Total Dwellings in this issue are:
 | 2000-01 | 2001-02 | 2002-03 | 2003-04 | 2004-05 | 2005-06 | Total |
|
| NSW | - | 52 | 138 | 436 | 445 | 126 | 1 197 |
| Vic. | - | - | - | 3 | - | - | 3 |
| Qld | 3 | 2 | 355 | 471 | 392 | 510 | 1 733 |
| SA | - | - | - | 62 | 4 | 6 | 72 |
| WA | - | - | 9 | 18 | - | -75 | -48 |
| Tas. | - | - | - | - | - | -6 | -6 |
| NT | - | - | - | - | - | - | - |
| ACT | - | - | - | - | - | - | - |
| Total | 3 | 54 | 502 | 990 | 841 | 561 | 2 951 |
|
The revisions relate to errors in reported data, including significant reporting errors dating back to 2002-03 for three councils (Murray in NSW and Gold Coast and Mackay in Queensland). These three councils account for half of the revisions.
INQUIRIES
For further information about these and related statistics, contact the National Information and Referral Service on 1300 135 070 or Paul Pamment on Adelaide (08) 8237 7499.
VALUE OF BUILDING APPROVED
NEW RESIDENTIAL BUILDING
The trend estimate for the value of new residential building has risen for the last four months.
ALTERATIONS AND ADDITIONS TO RESIDENTIAL BUILDING
The trend estimate for the value of alterations and additions to residential buildings rose 0.1% in March 2006.
NON-RESIDENTIAL BUILDING
The trend estimate for the value of non-residential building fell 1.2% in March 2006, the fifth consecutive monthly fall.
DWELLINGS APPROVED
TOTAL DWELLING UNITS
The trend estimate for total dwelling units approved has fallen for ten consecutive months.
PRIVATE SECTOR HOUSES
The trend estimate for private sector houses approved has risen for the last three months after falls in the previous six.
PRIVATE SECTOR OTHER DWELLINGS
The trend estimate for private sector other dwellings approved has been in general decline since May 2005.
DWELLING UNITS APPROVED STATES AND TERRITORIES
SUMMARY COMMENTS
The trend estimate for total dwelling units approved fell 0.4% in March 2006. The trend fell in New South Wales (-3.8%), South Australia (-0.8%) and Western Australia (-1.5%) but rose in all other states and territories.
The trend estimate for private sector houses approved rose 0.3% in March 2006. The trend fell in New South Wales (-0.6%), South Australia (-0.5%) and Western Australia (-1.3%) but rose in Victoria (+0.8%) and Queensland (+1.6%).
 |  | NSW | Vic. | Qld | SA | WA | Tas. | NT | ACT | Aust. |  |
Original |  |
|  |
| Dwelling units approved |  |  |  |  |  |  |  |  |  |  |
 | Private sector houses (no.) | 1 277 | 2 708 | 2 350 | 677 | 1 856 | 217 | 78 | 78 | 9 241 |  |
 | Total dwelling units (no.) | 2 365 | 3 581 | 3 647 | 1 078 | 2 162 | 277 | 163 | 137 | 13 410 |  |
| Percentage change from previous month |  |  |  |  |  |  |  |  |  |  |
 | Private sector houses (%) | 12.7 | 12.2 | 7.8 | 13.8 | 5.5 | 35.6 | 1.3 | -6.0 | 10.0 |  |
 | Total dwelling units (%) | 2.5 | 22.0 | 22.9 | 27.7 | 9.5 | 60.1 | 94.0 | -44.1 | 16.3 |  |
Seasonally Adjusted |  |
|  |
| Dwelling units approved |  |  |  |  |  |  |  |  |  |  |
 | Private sector houses (no.) | 1 206 | 2 473 | 2 107 | 640 | 1 694 | na | na | na | 8 492 |  |
 | Total dwelling units (no.) | 2 314 | 3 319 | 3 197 | 1 031 | 2 039 | 280 | na | na | 12 484 |  |
| Percentage change from previous month |  |  |  |  |  |  |  |  |  |  |
 | Private sector houses (%) | 1.4 | 0.1 | -6.4 | 3.7 | -8.0 | na | na | na | -2.5 |  |
 | Total dwelling units (%) | -1.4 | 6.2 | -1.4 | 9.3 | 0.2 | 39.3 | na | na | 2.2 |  |
Trend |  |
|  |
| Dwelling units approved |  |  |  |  |  |  |  |  |  |  |
 | Private sector houses (no.) | 1 180 | 2 478 | 2 085 | 639 | 1 767 | na | na | na | 8 501 |  |
 | Total dwelling units (no.) | 2 371 | 3 174 | 3 004 | 836 | 2 200 | 234 | 113 | 188 | 12 121 |  |
| Percentage change from previous month |  |  |  |  |  |  |  |  |  |  |
 | Private sector houses (%) | -0.6 | 0.8 | 1.6 | -0.5 | -1.3 | na | na | na | 0.3 |  |
 | Total dwelling units (%) | -3.8 | 1.1 | 0.9 | -0.8 | -1.5 | 4.9 | 5.6 | 5.6 | -0.4 |  |
|  |
| na not available |
DWELLING UNITS APPROVED
STATE TRENDS
NEW SOUTH WALES
The trend estimate for total dwelling units approved in New South Wales has been in decline for the past fourteen months. The trend for private sector houses has fallen for the past nine months.
VICTORIA
The trend estimate for total dwelling units approved in Victoria is showing rises for the last four months. The trend for private sector houses shows small rises for the last four months.
QUEENSLAND
The trend estimate for total dwelling units approved in Queensland is now showing small rises for the last two months. The trend for private sector houses has risen for the last four months.
SOUTH AUSTRALIA
The trend estimate for total dwelling units approved in South Australia is now showing falls over the last five months. The trend for private sector houses has fallen for the last four months.
WESTERN AUSTRALIA
The trend estimate for total dwelling units approved in Western Australia is now showing falls for the last two months. The trend for private sector houses is now showing falls for the last three months.
 Print Page
 Print All